Power BI - HR Analytics and Visualization
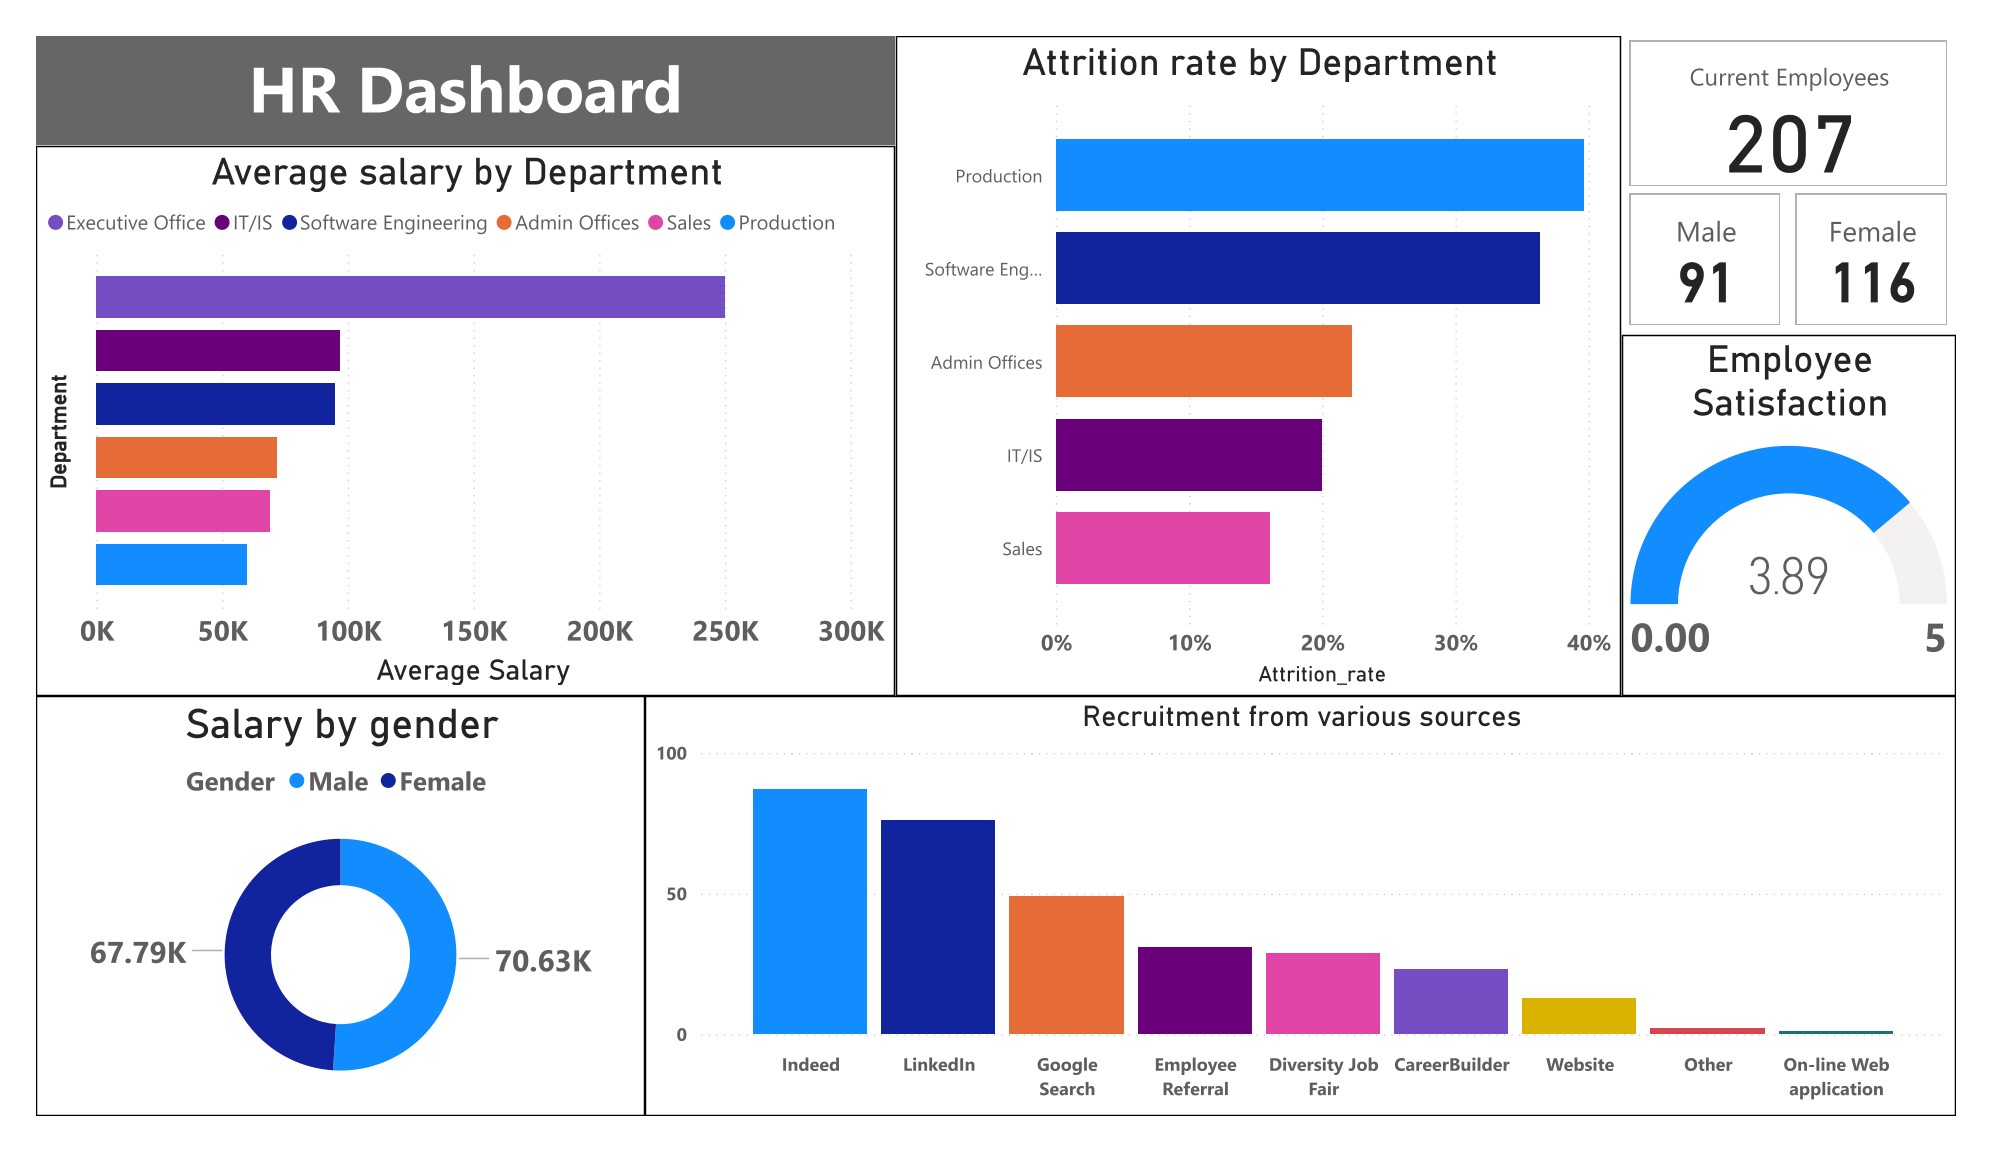
Built an interactive dashboard visualizing key HR metrics - salary, attrition, satisfaction, and recruitment - using the cleaned dataset from the Excel project.
This site is for making it easier to access the projects mentioned in the resume -> Latest Resume
You can also directly checkout the github repo where I keep all these projects from here -> Portfolio projects.
Built an interactive dashboard visualizing key HR metrics - salary, attrition, satisfaction, and recruitment - using the cleaned dataset from the Excel project.
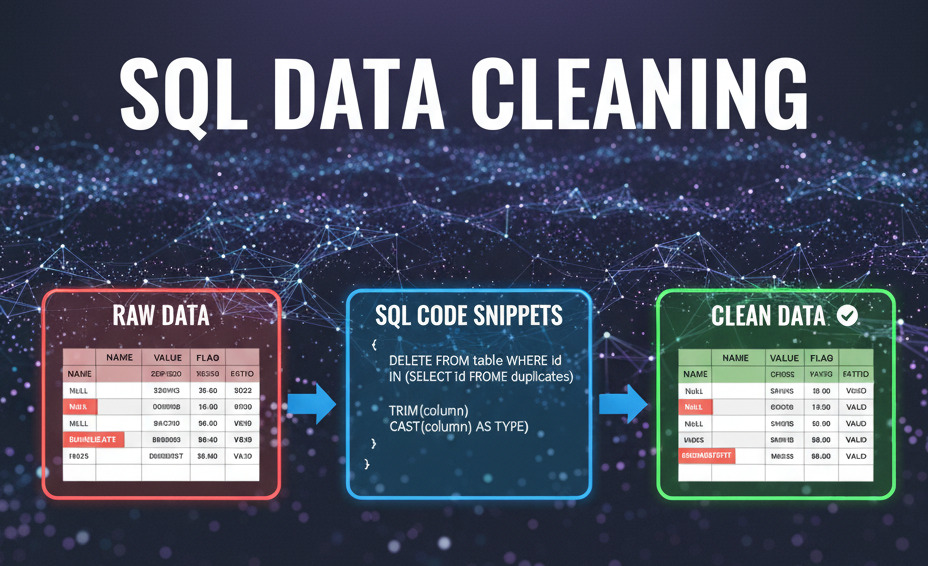
Cleaned and standardized a dataset of 10,000+ Goodreads books by removing duplicates, normalizing author and publisher fields, and converting publication dates to proper datatypes to ensure accuracy and consistency.
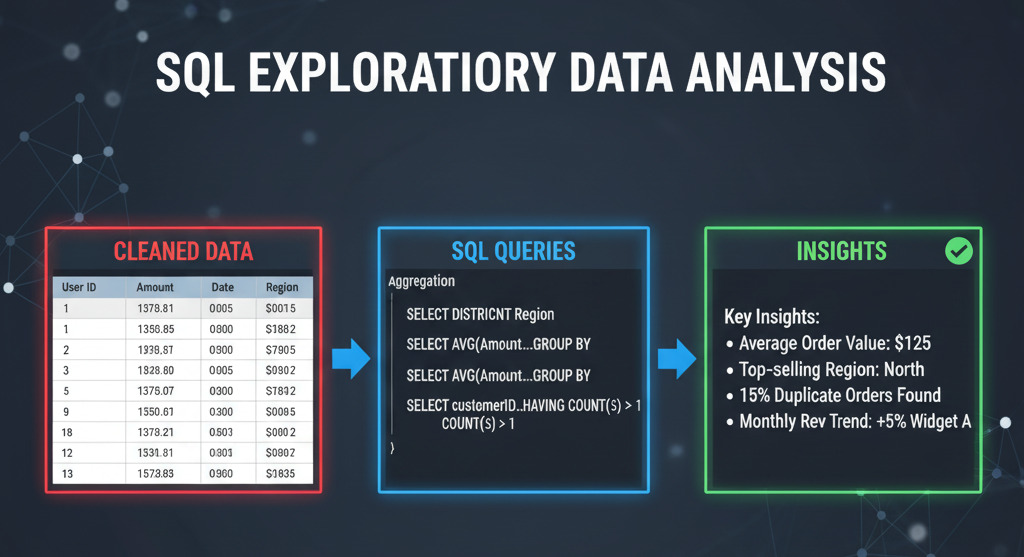
Performed SQL-based analysis using CTEs, window functions, and aggregations to rank top books by year and publisher, while identifying patterns in ratings distribution, language trends, book popularity, and publisher performance.

Cleaned and prepared raw HR data in Excel, creating custom metrics and dynamic pivot tables to enable accurate analysis. Built a single-page interactive dashboard that visualized key workforce metrics such as attrition, salary distribution, and employee satisfaction, uncovering trends to support data-driven decisions on retention, compensation, and employee well-being.